Difference between revisions of "Resin Calibration Charts"
m |
|||
| Line 23: | Line 23: | ||
The numbers at the bottom of the card are the exposure time for that column in multiples of 2 seconds. The features in the column start at 1mm and decrease by 0.1mm with each row. After 0.1mm the features decrease by 0.01mm per row. The resolution of the printer is 0.045mm so the lower four rows are not expected to be correct. | The numbers at the bottom of the card are the exposure time for that column in multiples of 2 seconds. The features in the column start at 1mm and decrease by 0.1mm with each row. After 0.1mm the features decrease by 0.01mm per row. The resolution of the printer is 0.045mm so the lower four rows are not expected to be correct. | ||
| − | * Start from top and locate first well formed column | + | * Start from top left and locate first well formed column |
* Move to bottom last visible circle | * Move to bottom last visible circle | ||
* Move right until the circle starts to clog | * Move right until the circle starts to clog | ||
* Backtrack one column | * Backtrack one column | ||
* That's your sweetspot | * That's your sweetspot | ||
Latest revision as of 17:26, 28 November 2019
A page to collate resin calibration charts for the Anycubic Photon 3D printer.
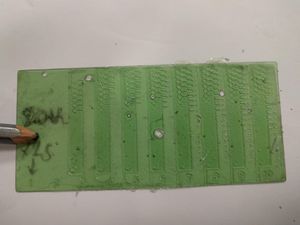
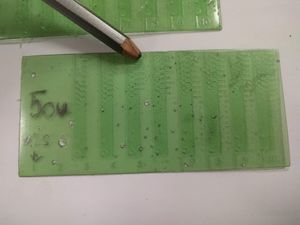
It is possible to print a Calibration Chart for a specific layer height with your resin to find a good starting point.
This process requires changing the printer's settings, printing one or more charts, and then restoring the previous settings. **Please make sure you are confident that you can restore the standard settings before starting this process.**
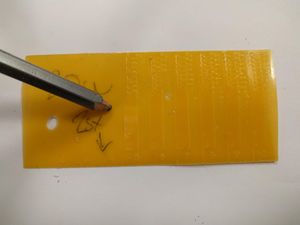
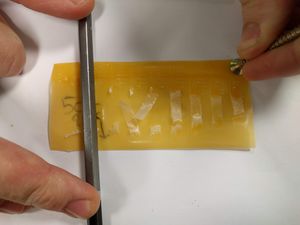
As an opaque resin the AnyCubic Orange appears to require a much longer cure time (20s at 20 microns) and is very sensitive to bed levelling.
Test cards for AnyCubic Translucent Yellow resin will be uploaded when I am back in the space to photograph them.
Currently the test cards are being kept near the printer for ease of reference.
Reading the Test Cards
The numbers at the bottom of the card are the exposure time for that column in multiples of 2 seconds. The features in the column start at 1mm and decrease by 0.1mm with each row. After 0.1mm the features decrease by 0.01mm per row. The resolution of the printer is 0.045mm so the lower four rows are not expected to be correct.
- Start from top left and locate first well formed column
- Move to bottom last visible circle
- Move right until the circle starts to clog
- Backtrack one column
- That's your sweetspot


